 Thermal Performance of Light Straw-Clay Thermal Performance of Light Straw-Clay
|
Thermal Testing
In 2004 Design Coalition worked with the Forest Products Laboratory, US Department of Agriculture (USDA) Forest Service (FPL), in Madison, Wisconsin to perform thermal testing on some samples of straw-clay material. To our knowledge, these are the first such tests of straw-clay to be conducted under professional laboratory conditions in the USA.
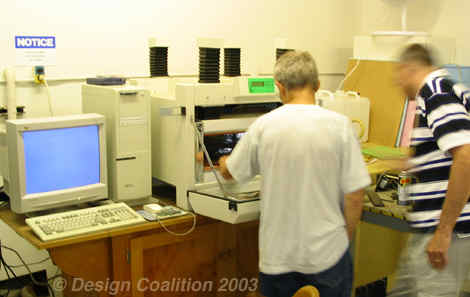
(left) The Laser Comp Heat Flow Meter Instrument is known informally at FPL as the "K-tester". "K" is the designation in the USA for thermal conductivity. |
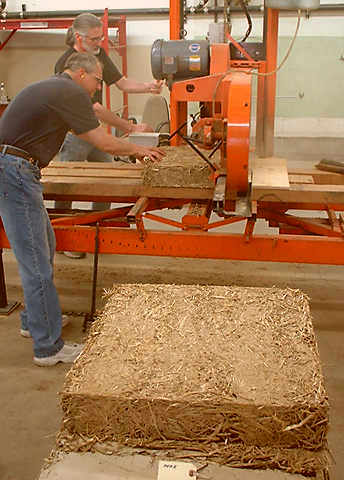
(above) Bob Munson of Forest Products Laboratory assists Larry operating the WoodMizer saw to trim the top and bottom surfaces of each sample. |
Trimming the samples is necessary to ready the them for the testing apparatus, which requires very flat, parallel surfaces for accurate thermal measurement.
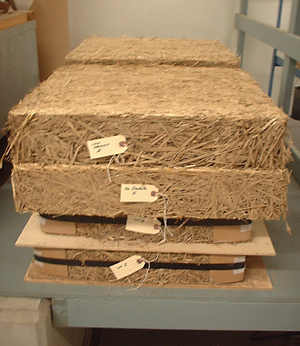
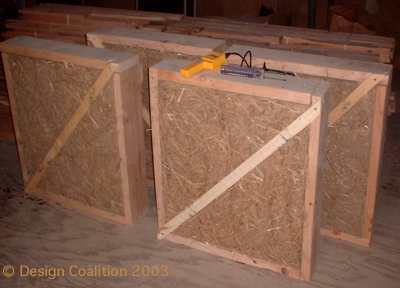
(below) The samples are stacked and tagged. Before being ready for the K-tester however, they were fully acclimatized in FPL's humidity- and temperature--controlled room as described in the FPL publication entitled "Engineering Report of Light Clay Specimens".
|
 |
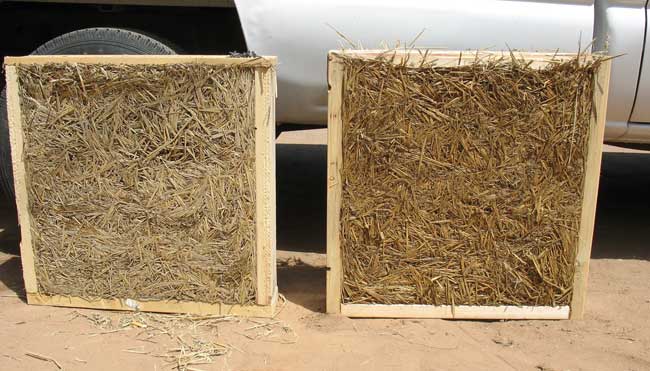
The 8 samples varied in the proportions and type of straw and clay. Each sample was carefully weighed, before and after trimming, to accurately calculate density. Density makes a difference; based on tests done in Germany in the 1980's, we expected that a less-dense, straw-rich mix will have a better R-value than a heaver mix with more clay and less straw. (Our walls in the upper Midwest USA are of very light — that is, more insulating — variants of the samples tested.) |
|
 |
(left) Chart showing thermal performance versus density from Franz Volhard's book on leichtlehm construction. The red oval indicates the density and thermal range for very-light straw-clay."Leichtlehm" translates as "light loam", or "light clay". Examples of "heavy" construction ("Strohlehm" and "Massivlehm" shown at the lower end of the chart) are adobe, rammed earth and cob. As the chart shows, the thermal conductivity of those types of walls is too great to provide enough insulation for Wisconsin's winters. With this important thermal test data, we can establish an optimum mix for straw-clay walls for colder USA climate zones.
Download the full FPL report (2.3 meg PDF) |
Straw lightly coated with clay particles works as insulation for buldings because, like other insulations, it is primarily made up of small air pockets. The pounds per cubic foot (pfc) — that is, the density — of the wall increases as more and more subsoil is added to the same amount of straw (see chart below).
FPL's graph above shows the combined test results. It demonstrates the relationship of R-value to density in light straw-clay. This connects well with the intuitive observation that subsoil is the primary thermal conductor as well as the primary source of weight in this type of insulation. And that therefore a greater quantity of it in a wall will make a more-dense and more-conductive wall.
The Forest Products Laboratory report concluded that their results correlated positively with similar testing done in the mid-1980s in Germany. [Volhard, et.al. 1983]. The FPL investigation verified that the insulating value of straw-clay varies consistently and predictably with installed density. Their Table 1 below shows the numerical values of the graph above.
(below) Data from FPL Table 1 above shown as a graph. It shows the exponential nature of the wall density vs. insulation properties. An exponential fit of this FPL data yields the equation R per inch = 2.1659e-(0.019)(Wall lbs./cu.ft.), R2 = 0.9844. This equation allows us to calculate the specific quantities of straw and clay required to attain a target R-value.
Density and R-Value
In practice, the building designer can specify the desired density and R-value for a given project, and an experienced installer will have the ability to meet the specified density onsite as installed. Important to note in the chart below is that for all densities, the amount of straw remains constant and only the change in amount of subsoil accounts for the density —and therefore R-value— difference.
Density is readily determined by weighing a cured sample and measuring its volume. We continue to take samples on-site from each project, for curing and testing. However, sufficient data has accumulated to express with confidence the characteristics of straw-clay mixes, ranging from lighter to heavier.
Thermal Mass of Light Straw-Clay
Unlike most other insulation materials, light straw-clay also has some usable, measurable thermal mass. This property is benficial for storing heat. In a house this can help save energy by smoothing out the peaks and valleys of heat flow — for example, temporarily storing some of the sun's heat that that enters windows during a cold day, and releasing it into the home during the night. Designers use specific heat capacity to estimate the thermal mass effect on a building's heating and cooling performance.

© 1995-2020 Douglas Piltingsrud and Design Coalition, Inc.
All rights reserved. This material may not be reproduced or re-used in any form without express written permission. |